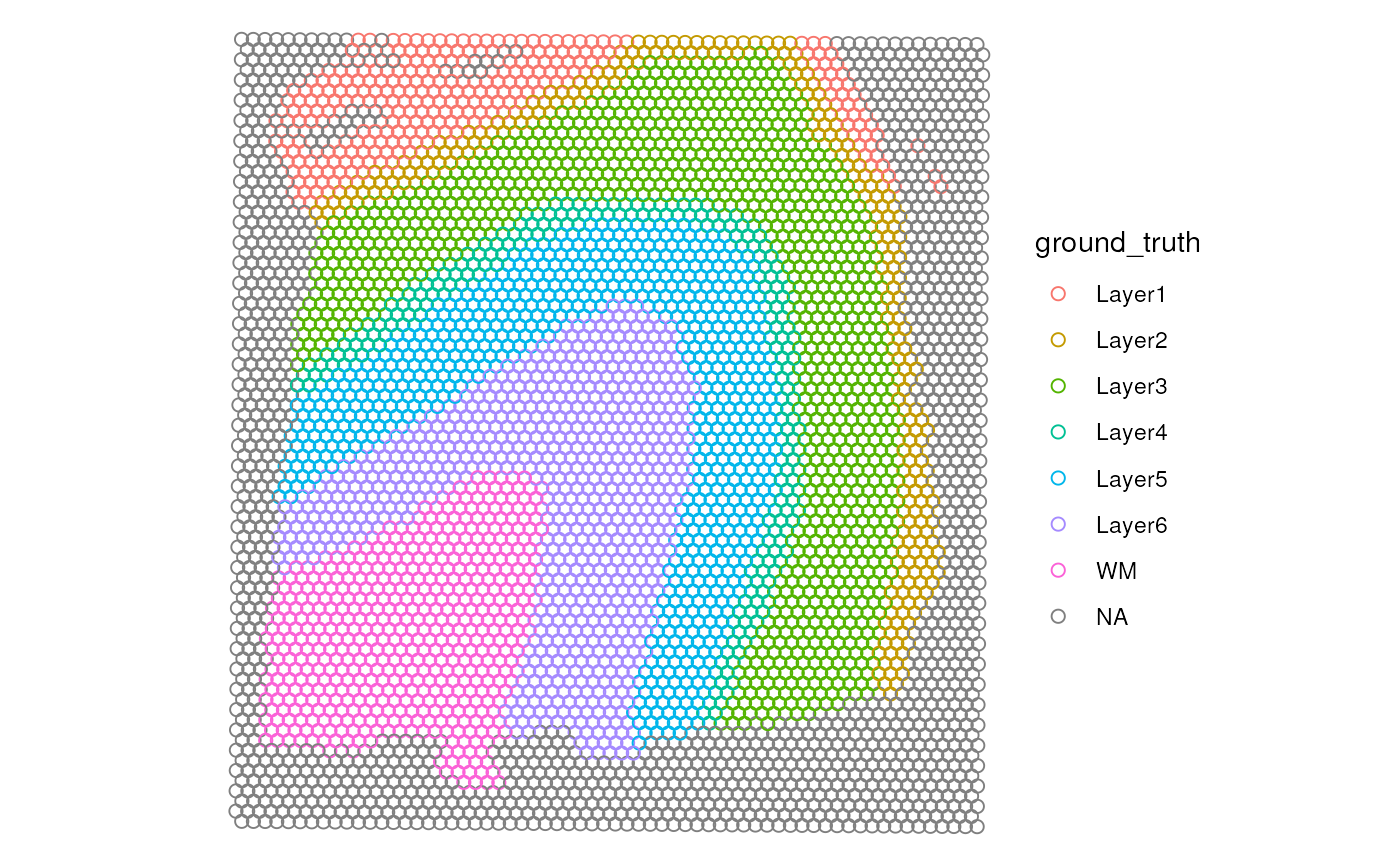
Adding border to highlight the ground in the spatial map
Source:R/add_ground.R, R/add_group_bin.R
add_ground.RdAdding border to highlight the ground in the spatial map
Usage
add_ground(p, var, stroke = 0.5, point_size = 2, ...)

add_ground_bin(p, var, bins = 30, stroke = 1, point_size = 3, ...)
Arguments
- p
a spatial map created by
make_escheR(), with or without other layers of aesthetics.- var
A character(1) with the name of the colData(spe) column that has the values to be used as the background.
- stroke
A numeric(1) specifying the thickness of the border.
- point_size
A numeric(1) specifying the size of the spot in the ggplot. Defaults to 2.
- ...
Reserved for future arguments.
- bins
numeric vector giving number of bins in both vertical and horizontal directions. Set to 30 by default.
Examples
library(STexampleData)

spe <- Visium_humanDLPFC()
#> see ?STexampleData and browseVignettes('STexampleData') for documentation
#> loading from cache

make_escheR(spe) |>
    add_ground(var = "ground_truth")
