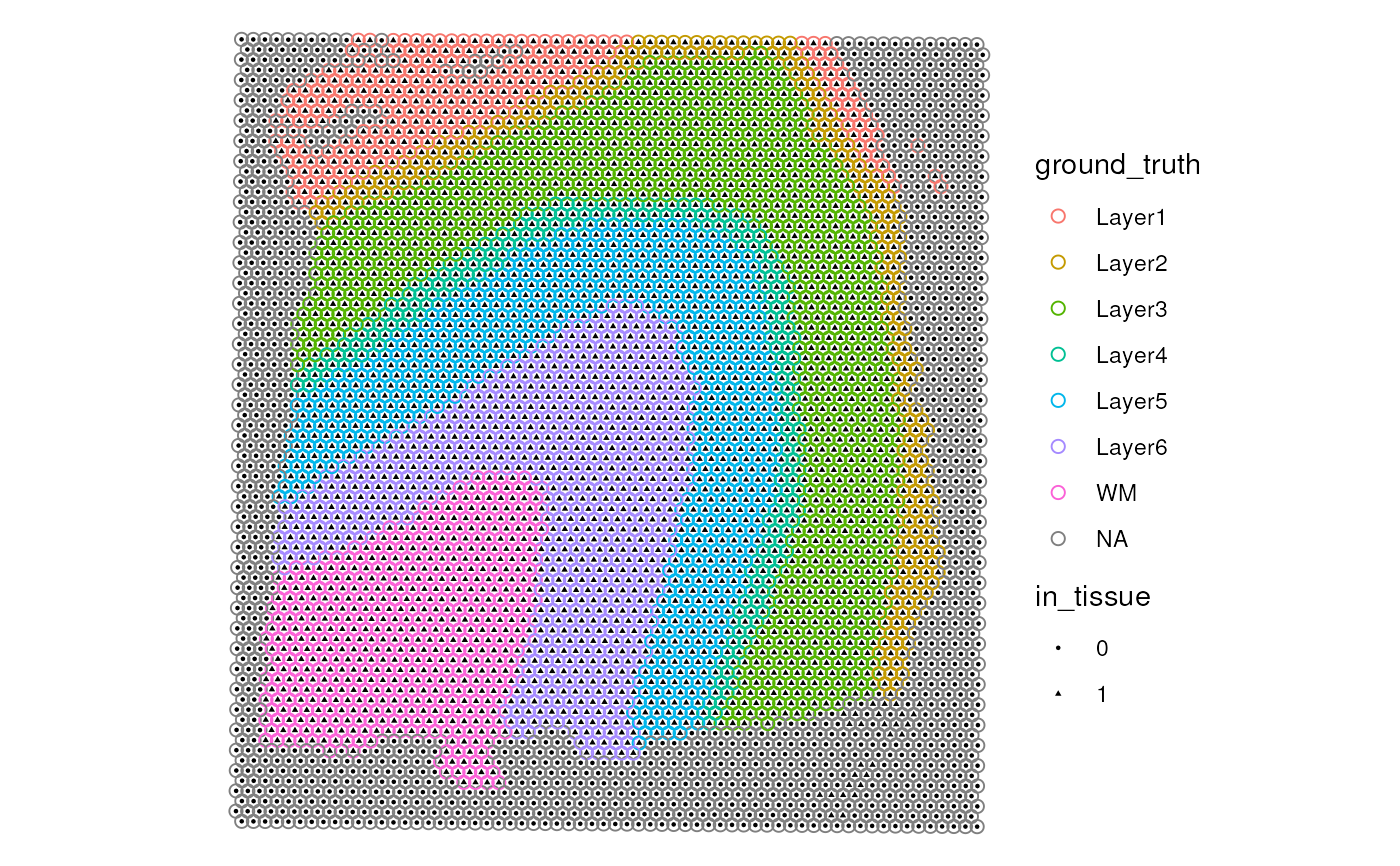
Adding symbols to each spot in the spatial map
Arguments
- p
a spatial map created by
make_escheR(), with or without other layers of aesthetics.- var
A character(1) with the name of the colData(spe) column that has the values to be used as the background.
- size
A numeric(1) specifying the size of the symbols in the ggplot. Defaults to 1.
- ...
Reserved for future arguments.
Examples
library(STexampleData)

spe <- Visium_humanDLPFC()
#> see ?STexampleData and browseVignettes('STexampleData') for documentation
#> loading from cache

# Convert a continuous variable to categorical
spe$in_tissue <- factor(spe$in_tissue)

make_escheR(spe) |>
    add_ground(var = "ground_truth") |>
    add_symbol(var = "in_tissue", size = 0.5)

